
Investing in Energy Technology Requires a Business Case
Establishing a business case for new energy technologies is a complicated task. It requires input and coordination of analysis across engineering, strategic, operations and finance. Often, these departments do not speak the same ’language’ and have conflicting needs.
deepenergy.ai energy modelling software was designed to empower anyone in the organisation with the tools to develop rapid energy models to meet diverse stakeholder needs.
- Engineering can simulate equipment operation using computer algorithms,
- operations and strategic can build scenarios to achieve energy KPIs objectives and goals, and
- finance can model alternative price projections over time and assess payback, BCR and NPV to meet budgets and cost-of-capital requirements.
All of this can now be done from a single application without the need for segregated and complex engineering and financial modelling in spreadsheets. deepenergy.ai provides a data-science driven approach that unites disciplines, reduces risk, improves accuracy and analysis time-to-insight.
The below diagram shows the deepenergy.ai energy modelling software strategy:

Planning
Energy Planning Workshop
Energy related design considerations are increasingly important to achieve certifications, both voluntary and mandatory. Requirement gathering at this stage can provide valuable design input as to which combination of building envelope, plant and equipment will provide the best energy performance – thereby reducing risk and cost simultaneously.
An Energy Planning Workshop functions to address the following:
1. What Scenarios Should be Tested?
Scenarios to be tested against the ground-truth may include:
- add/upgrade solar PV system capacity;
- add/upgrade a battery energy storage system;
- add/upgrade controls over demand flex plant & equipment;
- add load shifting (pre-heat/pre-cool);
- reduce/increase electrical demand or consumption (e.g. EEOs, electrification);
- battery operational mode: FCAS and/or arbitrage;
- add an embedded network, calculate revenues;
- change of retail tariff analysis;
- change of network tariff analysis;
- wholesale market participation;
- optimal load profile (for wholesale market participation);
- amongst others.
2. Is NEM12 Electricity Data Available?
While NEM12 is not an absolute requirement, it is the correct data to use for cost assessments of changes to electricity supply contracts. Correct? As in, it is the same source data used to generate your electricity invoice. It contains active and reactive power observations, and from that peak demand is calculated. It is standardised, removing the infinite variability of random CSV files.
Worst case? A CSV can be processed - but this will always take more time. Fields have to be mapped. Time date formats have to be normalised/concatenated. Therefore it is usually worth spending time chasing down the NEM12 data.
3. What resolution is Natural Gas data?
Most existing building stock makes use of natural gas as an energy source. If in a small market connection, there may exist infrequent manual reads while in large market connections from a Volume Boundary Meter (VBM) can yield daily or hourly resolutions depending on what has been configured by the gas supplier.
If BMS or other operational data is available, an estimation of load profile can be generated as an assumption.
4. Combined energy load profile
Using a combination of electricity and natural gas (converted to kWh rather than the traditional GJ), a daily energy load profile is calculated. With electrification being the topic of concern, the normalised kWh figures can be processed through the electrical tariffs. Capital costs and other line items required for works can be added as assumptions to the Rapid Cost Assessment.
deepenergy.ai
The energy modelling software was designed during the course of the CSIRO Data Clearing House 6.1 project to overcome the challenges of modelling advanced energy management systems to produce output BCR and NPV inline with treasury guidelines.
Background
The Challenge
5-minute electricity interval data, standard in the Australian National Electricity Market, equates to 105,120 observations per annum, per meter. Multiply this by three - active and reactive power (supplied in source data) and the calculated peak demand figure in KVA. So - 315,360 observations.
Two years of data is required to calculate the rolling 12-month maximum demand figure for day 1 of the first year of ground truth. This increases the figure to 630,720 observations.
Each scenario model generates calculated (or ‘mutated’) electricity load profiles for the full year across each of the three data streams. Therefore, each scenario modelled adds 315,360 observations.
If we extrapolate this out for the NSW Schools Demand Flex project - 3x schools with 8x what-if scenarios each. Therefore this database consists of >9.4 million observations.
In order to calculate maximum demand, tariffs and wholesale spot price accurately, the 5-minute data resolution needs to be preserved and processed correctly and according to rules and regulations for electricity retailers.
The scale of calculations coupled with the complexity of energy related variables called for the development of a spread sheet replacement - a database driven web application.
The Solution
A team of domain experts and software devs worked on a database-driven computer-science approach capable of transforming data at scale, binding variables, and non-linear assumptions to model inputs and automate calculations.
The energy modelling software, deepenergy.ai was born.
A system of polyglot architecture and software that enables the user to make changes to model inputs verbatim, run algorithms to simulate equipment operation and generate financial calculations with improved accuracy and speed.
> Machine learning powered variable load disaggregation from a single electricity utility meterThe result
A web-based application – custom built by Buildings Evolved to help determine the best mix of energy generation, storage and demand management option during predesign so that you can confidently brief engineers on solutions that deliver the best financial outcomes.
- Easily accessed site and building energy data is transformed in the CSIRO data-driven smart building data clearing house and processed by complex algorithms – simulating a ground truth built from the real world.
- Adjusted and new variables can generate what-if scenarios – capturing upfront capital and ongoing operational costs over fifty-years.
- Each scenario generates a top-level business case, using NSW Treasury standard BCR and NPV measures. Rapidly assess the financial and engineering implications of energy measures over a project lifecycle.
deepenergy.ai
How It Works
Data-driven software has the ability to derive truth using machine learning. The implication? Data from a single electricity meter can provide detailed insights for modelling.
Data requirements
- Attain a ground truth year from NEM12 data. For green field sites, use representative precedent data or create via an rapid physics-based model.
- Behavioural analysis underpinned by machine learning and genetic algorithms discovers variable electrical loads – loads that do not conform to any known schedule or regular pattern.
- Automatically identify inflexible electrical loads.
- Calculate multiple years of data to accurately represent electrical demand on an interval-by-interval basis.
- Combine with network and retail tariffs to recreate billing data as a point of validation.
- Machine learning can equally be run on sub-meter data, if readily available.
Scenario modelling
Create child scenarios based on the ground truth; for example:
- Change tariff
- Use wholesale spot price (as retail tariff)
- Add solar PV (simulation)
- Add demand reduction strategy (simulation)
- Add load shifting strategy (simulation)
- Add battery optimisation for arbitrage (simulation)
 > Here we use basic assumptions to create a ground truth (length of analysis, discount cash rate, electricity price forecast).
Analysis
Run quick analysis via web-based reporting.
- Machine learning cluster
- Load disaggregation
- Daily load profiles
- Daily cost profiles
- Cash flow projections
Export raw data from the web-based report outputs as CSV to import into existing reporting tools
Understand the proposition in business terms, not jargon
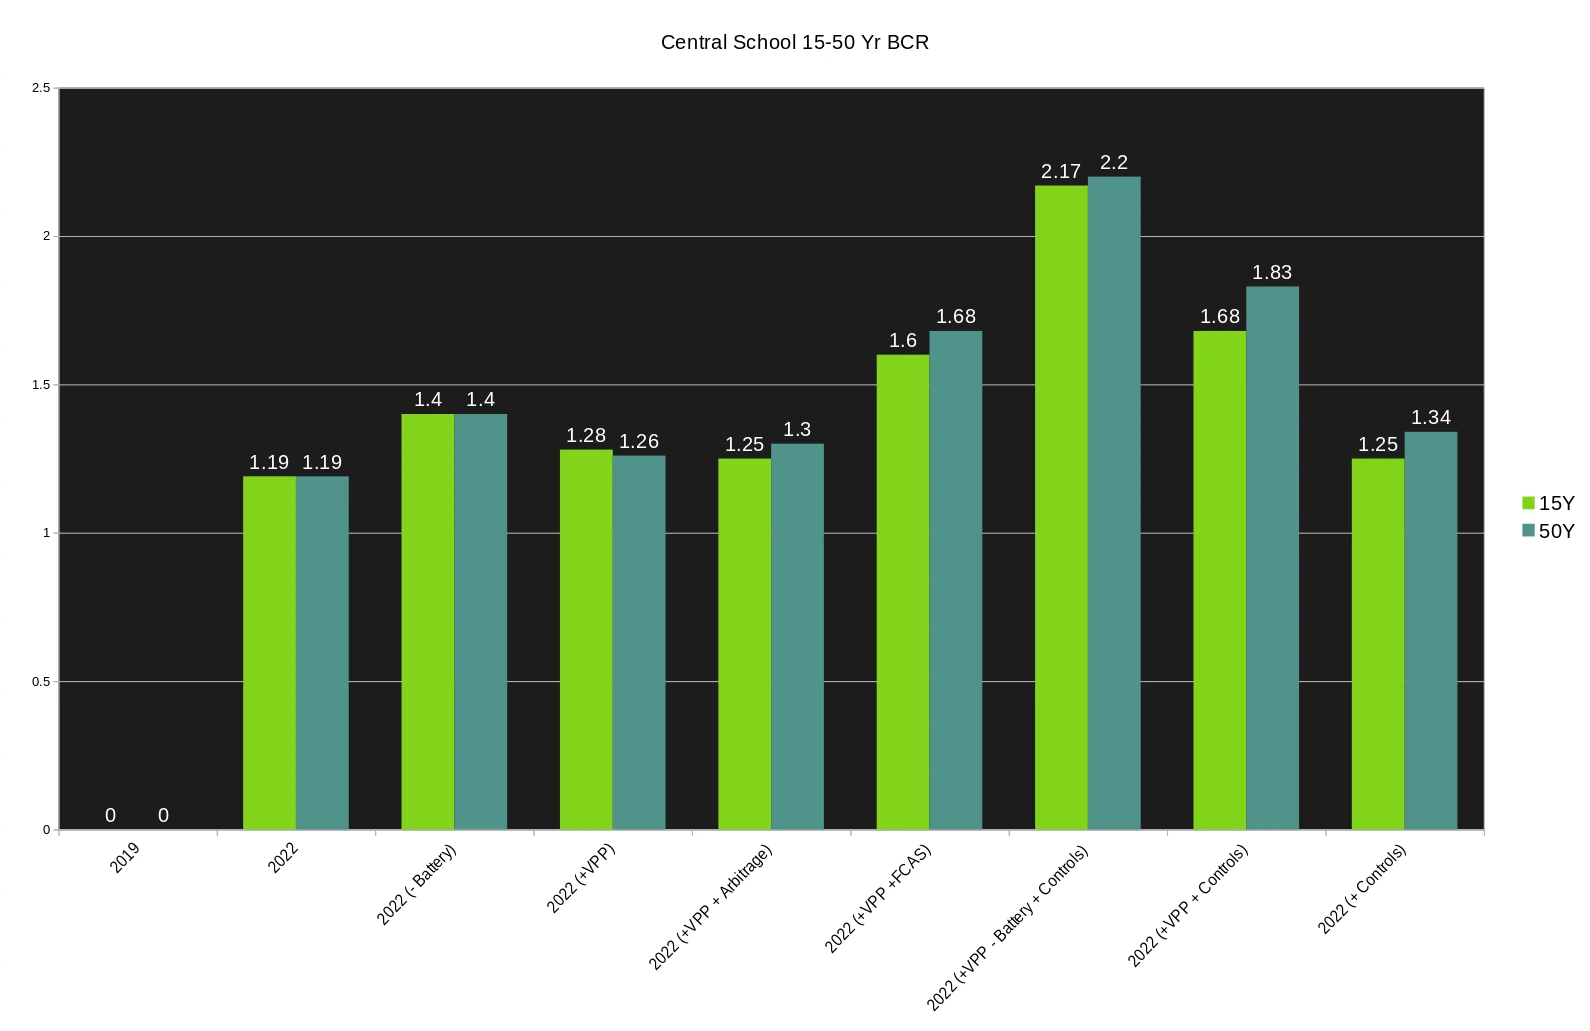
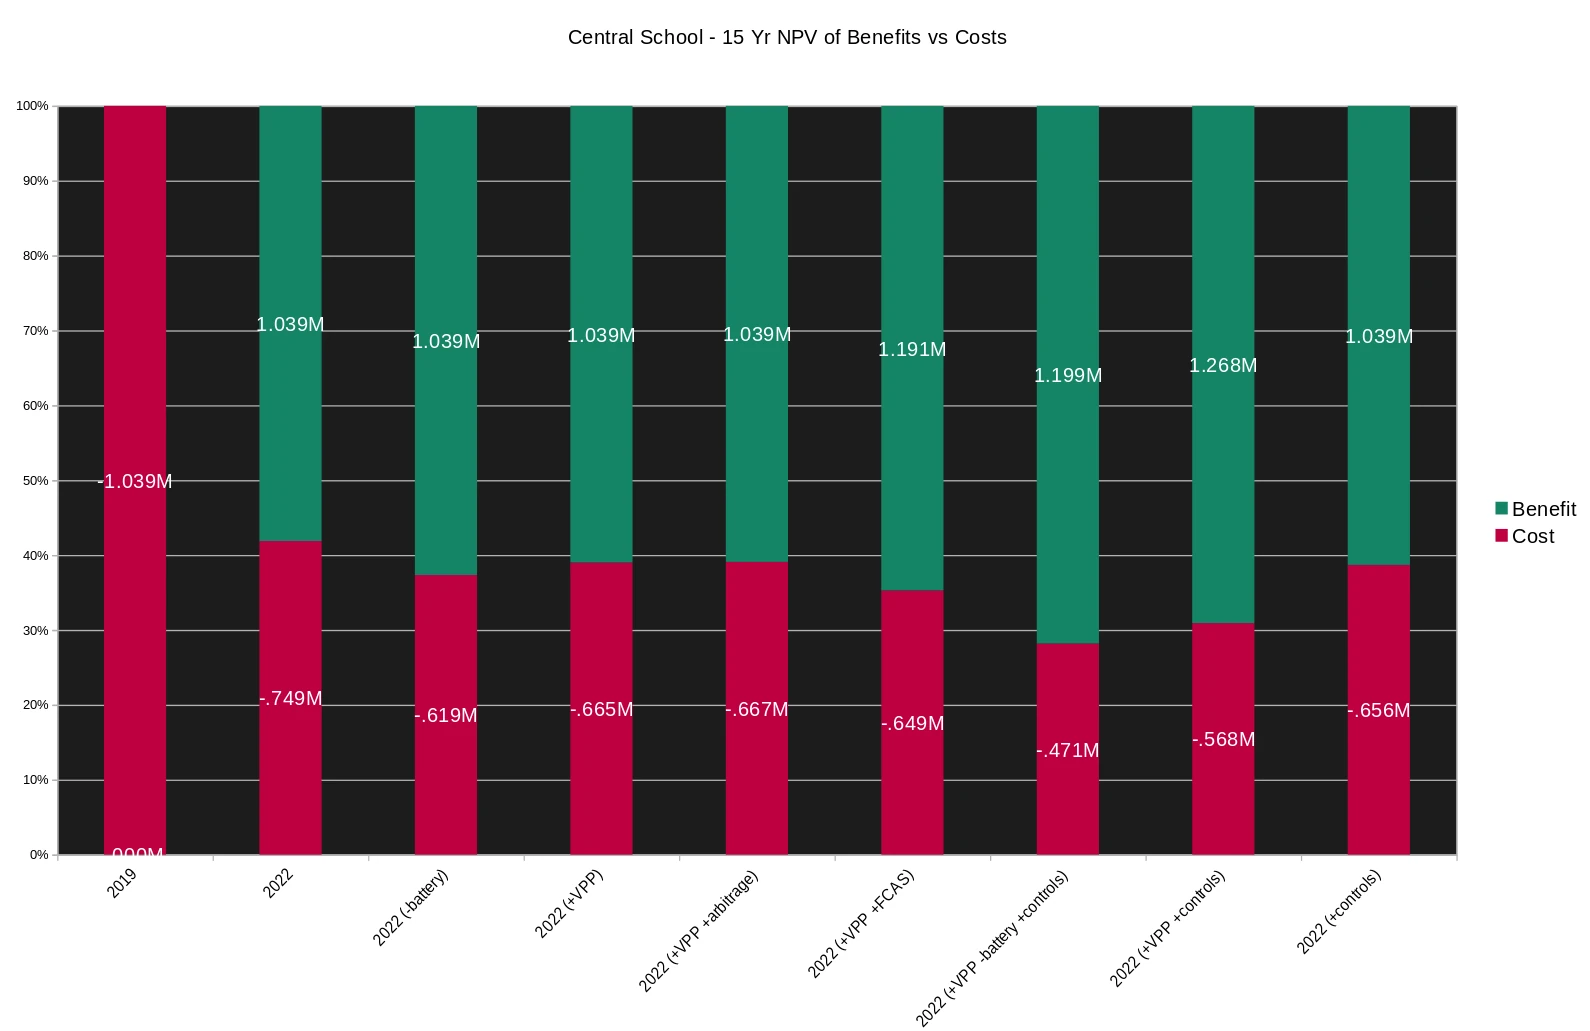
Add basic financial parameters such as projected energy prices, inflation, discount cash rate and projection duration (up to 50 years) to generate benefit-cost-ratio (BCR) and net-present value (NPV) calculations at 15 and 50 years.
Specifications
Data ingestion & transformation
| Features | Benefits | Value |
|---|---|---|
| Transform NEM12 and interval data | Prepare time-series data for modelling with ease, and process millions of records with a few clicks. | Avoid manual data handling, tedious and repetitive calculations, improve accuracy, and reduce time to analysis, error and risk. |
| Client asset register | Easily add and edit client data: sites, buildings and equipment to accurately aggregate time-series data in an automated manner. | Realise a source of truth for slow-changing client data to avoid tedious manual data entry and repetition. |
| Baseline as-built and identify flexible loads | Easily disaggregate time-series data to identify flexible loads such as HVAC used to estimate benefits of demand response, peak demand management and load shifting functions. | Avoid the need for complex spreadsheet models that require date-time matching from internal engineering and operating requirements. |
Modelling engines
| Features | Benefits | Value |
|---|---|---|
| Technology options evaluation | Find the best technology mix, quickly. Easily discover optimal equipment based on type, cost, operating and regulatory variables using inbuilt optimisation algorithms. | Avoid the hype, find the optimal technology mix quickly and improve the quality of advice to clients. |
| Model the wholesale spot price (WSP) | Accurately model the benefit of wholesale pass-through contracts with one-click time-series calculations between client and WSP data. | Modelling the WSP requires 100,000+ calculations per electricity meter p.a. (not possible to do with spreadsheets). |
| Model the benefit of smart buildings | One-click template scenarios that simulate model predictive control algorithms from a baseline, taking into account internal control goals, energy optimisation, peak demand management, thermal comfort, and the WSP. | Show clients how they can improve thermal comfort, and energy productivity, reduce emissions, save money, and potentially generate income with smart building control algorithms. |
| Model a tariff change | One-click tariff change to quantify the benefits of a change in energy tariffs or create your own time-of-use (TOU) tariffs via the web-form. | Leverage a tariffs library of predefined tariffs. Model an unlimited number of electricity tariffs without the need for manual calculations. |
| Emissions and net zero | NGERs and carbon calculations are automated from the generation of time-series data. | Demonstrate how potential scenarios will achieve sustainability goals without the need for manual calculations. |
Analysis tool-set
| Features | Benefits | Value |
|---|---|---|
| Flexibility and scalability | Create unlimited assumptions and scenarios, copy, edit and apply them to other sites or clients. Apply sensitivities, best, likely and worse case scenarios at the assumption or scenarios level with ease. | Avoid tedious aggregation and calculations in building scenarios or in applying scenarios to other projects, improve efficiency, and reduce time-to-analysis, error and risk. |
| Dynamic assumptions | Create and apply projection curves to assumptions, such as CPI or equipment degradation. Projection curves are stored in a library for application across scenarios and projects. | Accurately model the effect of changing costs and operating conditions over time. Improve efficiency and reduce time-to-analysis. |
| Financial calculations and charts | Model outputs <=50-year BCR and NVP in line with Treasury Guidelines and produce charts that communicate costs, benefits and ROI in your presentations. | Calculations and charts are created automatically with validation rules to ensure quality output. |
Additional Information
Use a data driven approach to rapidly find the best mix of energy and prop-tech related building components.
Getting Started
Step 1: Define/select tariffs
Here, we can either select an existing tariff from a library, or create our own.
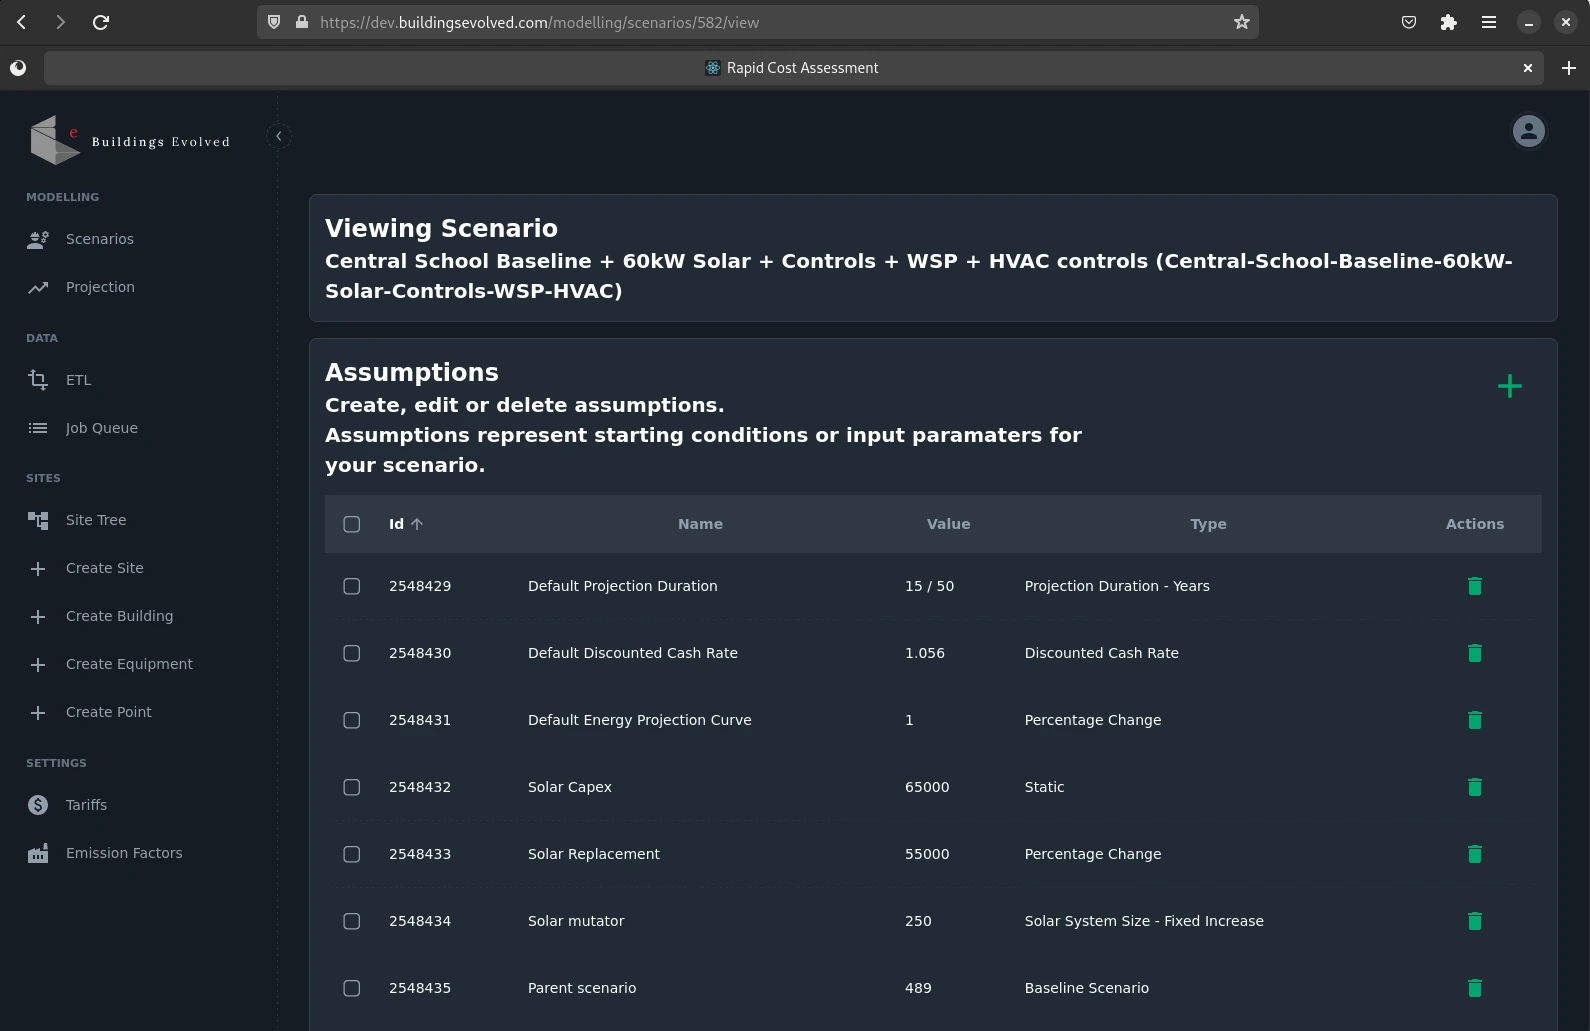
Step 2: Create simple metadata model
Here, we define the NMI, tariffs, solar panel sizes, and other model constraints.
Step 3: Process meter data
Here, we upload a NEM12 file, or lacking that a CSV of gate meter data.