

Buildings Evolved have extensive experience with project inception, concept design and detailed design for large scale smart building data projects, typically in the $100m+ range.
Brick Schema Metadata Models
We can develop, or help you develop a Brick Schema metadata model. With extensive experience in an emerging field, we can provide a semantically sufficient model to suit your application needs.
Why?
- Building metadata models such as Brick Schema describe building objects in a consistent manner regardless of vendor or installer naming conventions.
- A Brick model allows an application to query different buildings using a standard set of classes and methods.
- Optimisation requires an understanding of physical constraints, so models may typically include cooling capacity of HVAC condensers, for example.
- The models explain the relationship between objects such that one application can be run on many disparate systems in different buildings.
- The CSIRO Data Clearing House utilises Brick Schema to allow transportable applications for the smart building data domain.
Data requirements
- Architectual, mechanical, electrical & hydraulic drawings
- An understanding of the target application requirements
Application ubiquity
Using a schema such as Brick (or forthcoming ASHRAE 223P) allows an application developer to produce code that works ubiquitously on buildings regardless of systems and processes within that building. It is a universal language to translate the world of IT to the world of operational technology.
Grafana Dashboards
Data requirements
- Real-time data feed from sensors and equipment
- Time series database such as the DCH
- Metadata using Brick Schema or similar
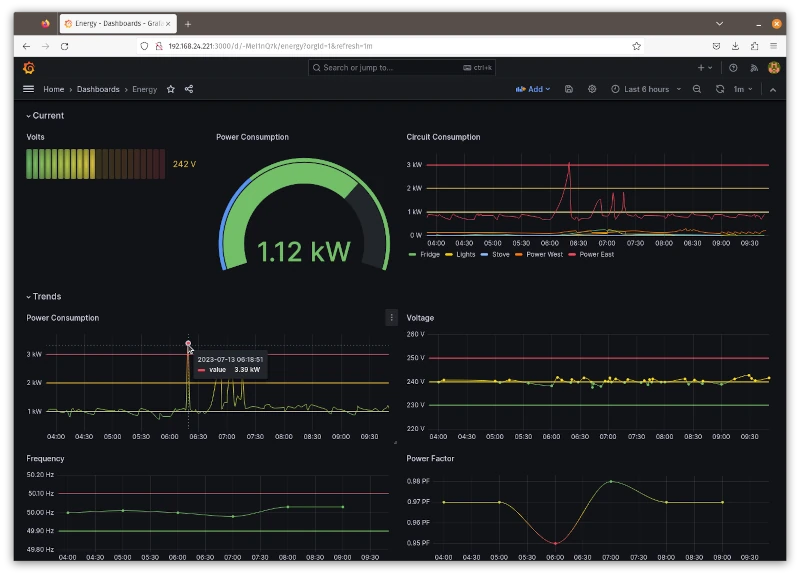
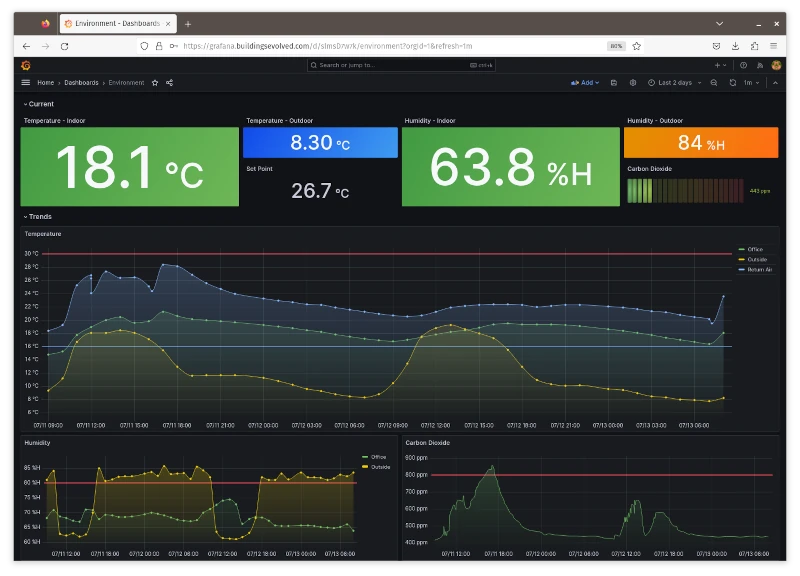
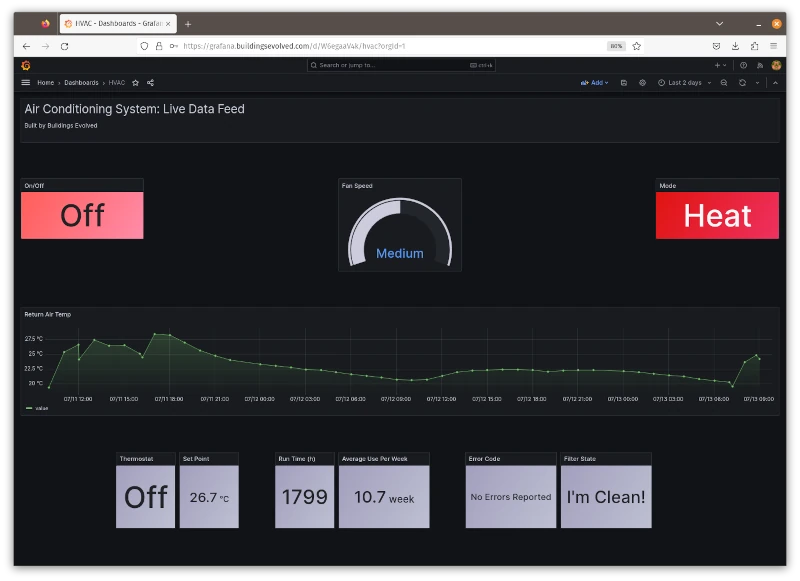
Dashboards can be offered to clients, authored in Grafana, connected to either the CSIRO Data Clearing House or to a local/proprietary database. The team also has expertise in deploying Tableau, Power BI and Tibco Spotfire business intelligence dashboards into Microsoft Azure & Amazon AWS.
Node-red Solution Design
Node-red is powered by node.js and provides a flow-based programming interface familiar to engineers and programmers. It is an open-source application maintained by the Opto-22 team, and uses terms and methods familiar to the controls industry. Node-red forms a “middleware” layer capable of seamlessly connecting operational technology to information technology.
Why?
- Node-red applications are easily deployable to IT devops solutions such as Docker, Kubernetes, OpenShift, Proxmox, VMWare and others.
- Node-red has bi-directional flow of data: optimisation algorithms executed in the cloud are relayed to edge devices using similar programming methodologies.
Data requirements
A specification of required Node-red functionality should be prepared as part of the detailed design phase so that it can be included in the tender for installation and commissioning of the building control systems.
Frequent and infrequent time series data
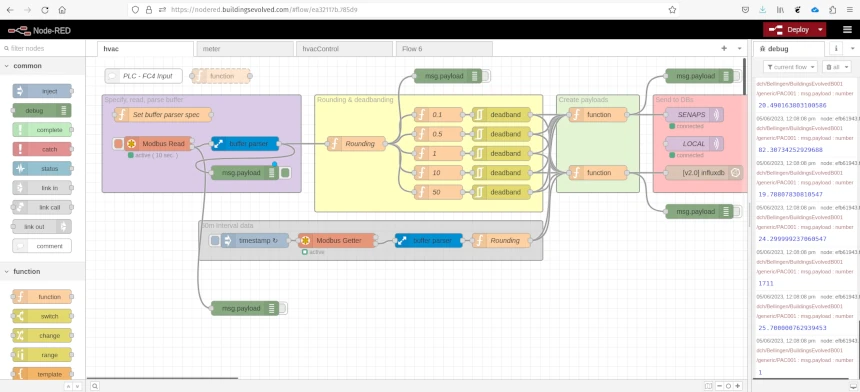
A default approach has been adopted by the team, but can easily be altered to suit different applications/domains. The approach consists of:
- An object catalogue per IP address
- Infrequent time-series data captured via dead-band filtering from a resolution of ~2 seconds
- Frequent time-series data captured every hour, on the hour
- Extract a large block of data from the source
- Use a buffer parser to split the buffer into constituent JS objects
- Send data to CSIRO data clearing house via MQTT
- Send data to other time-series database (optional)
- Prefer Modbus TCP over BACnet IP, as one is an IT standard, and the other is not really a standard. This becomes evident when trying to tunnel across a corporate network.
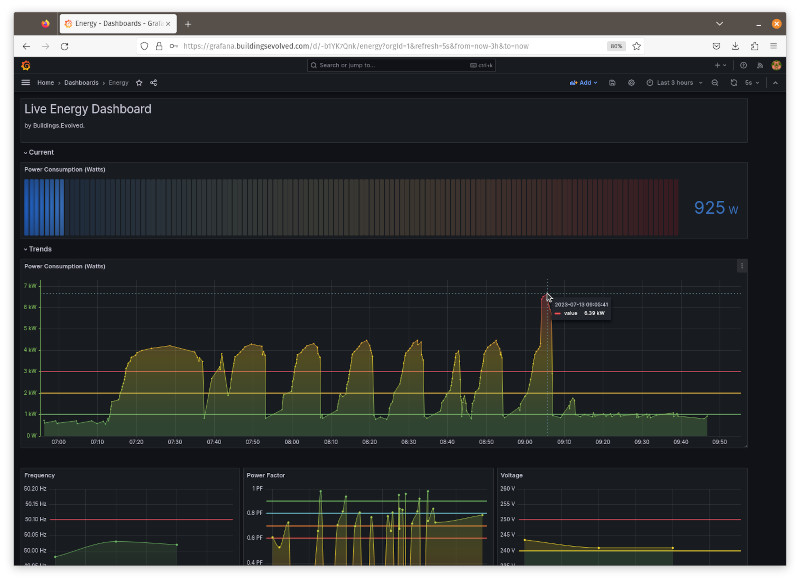 Infrequent data is shown capturing peaks in transient electricity demand from a real-time sensor data. Timestamp 09:05:41
Object catalogue from Brick Schema
Brick to node-red object catalogue creation is a feature of Deep Energy. This allows for the object catalogue to be defined once within the Brick metadata schema, and for the JSON catalogue to automatically created based on inputs to the single Brick model. The Brick model can be iterated upon until the object catalogue is created successfully.
The object catalogue generator understands buffer parser commands as key/value entity properties of points in the Brick metadata. These include offset, scale, deadband, length & IP address.
CSIRO Smart Building Data Clearing House (CSIRO DCH)
The CSIRO platform is pre-release and is made available to select R&D projects via Buildings Evolved.
Why?
- Single place for all your data: Collect all your building data in one place from disparate sources while retaining ownership irrespective of service providers.
- Get insights from your data: Discover new insights from your data by leveraging our smart building models.
- Apps to unlock your data: Deploy applications through DCH to supercharge your operations and analytics. App providers get access to building data without installing new hardware
- Unlock opportunity for advanced optimisation - The smart building data clearing house provides a unique opportunity for data providers and innovators to come together to improve the operation of the grid.
Where there are many vendors that have created vertically integrated platforms, CSIRO set out to create a horizontally integrated platform in recognition that stock markets operate on a similar precept. The data clearing house is intended to facilitate a marketplace of data and applications that provide value to these data. The owner of the data can share to vendors, consultants or other parties and control access revocation when respective works come to completion.
Optimisation Apps
Traditional approaches call for development of complex physics and building thermal models in order to optimise the building against. Open AI and reinforcement learning provides a new approach – data-driven rather than model-driven, supported by a simpler ontology.
Optimisation algorithms are typically executed in the CSIRO Data Clearing House on a schedule, using available sensor data and external datasets to determine the best operational strategy for the intervening period (user defined). Long term forecasts provide forward projections of optimum control. Unforeseen events (e.g. a generator tripping) are monitored to see if real-time actions are required, for example a price driven demand response mechanism.
A model-driven approach requires detailed building physics and simulated building controls to create a baseline – a theoretical level of performance that the building will be able to attain. LEED certifications in the United States expect a detailed model to underpin the design and delivery process. Real world building performance is compared to the simulation. The building, through upgrades and maintenance should maintain or better the performance indicated in the simulation. While this is a recommended approach with the increasing complexity of energy systems in the built environment, it is not always achievable, particularly on existing sites, or large existing portfolios of property.
A smart building data approach does not require detailed physics models in order to operate. Rather, a mechanism uses AI to “test” what happens with any given permutation or combination of variables within valid real-world physical constraints. A “reward” mechanism tells the algorithm if it did good or bad in with that particular combination of variables. It keeps trying until it finds the optimum mix of controls to achieve whatever the stated control strategy is designed to achieve. Data-driven approaches use neural networks to create an inference model. Learning algorithms use the inference model to determine what the next “guess” is. Rewards are issued when the system gets it right.
There are several levels of control possible:
- Rules-based control the set point and run on a schedule (smarter, but barely);
- ML based control of HVAC mode, fan speed as well as set-point, but still schedule on/off; or
- **Fu For example, if you have a sunny day, it is highly likely that electricity spot prices will go negative during the day. Then there is the question of how we induce demand artificially to take advantage of cheap prices (balancing the cost factors of the network tariff and maximum demand) – because, again, this is what the grid wants in that scenario.
External Data Sources
Data from the Bureau of Meteorology, the Australian Market Operator and CSIRO Energy are used to provide context for control optimisation forecasting. Aligning the forecasts of weather and electricity prices provides a powerful context from within to make decisions about control strategies. Price signals from actual wholesale spot price of electricity can be used to interrupt programmed control logic - price driven wholesale demand response, rather than using the formal mechanisms designed for very large consumers of electricity.
Price goes over $600/MWh? Time to do some load-shedding, perhaps. For example, if you have a sunny day, it is highly likely that electricity spot prices will go negative during the day. Then there is the question of how we induce demand artificially to take advantage of cheap prices (balancing the cost factors of the network tariff and maximum demand) – because, again, this is what the grid wants in that scenario.