
The IoT energy data platform under Project Darwin eliminated $400k per-annum in hardware and software costs, unified thousands of data sources from building assets and exceed voluntary and mandatory reporting requirements for NGERS, NABERS and ESG.
Location: Australia
Industry: Shopping Centres
Project Funding: $20M
Project Website: Vicinity Centres
Key Outcomes
- $400k vendor technology savings per annum
- Freed up 12-14 FTE personnel per annum
- 40+ reports automated
- 20+ Dashboards and BI tools created
Executive Summary
The IoT energy data platform was part of a $20-million comprehensive, portfolio wide, automated operational reporting system which improved decision-making at all layers. The solution eliminated unnecessary vendor solutions, improved data quality, reduced duplication, optimised resources, provided ease of access to quality information on energy consumption, billing, waste, and operational data, to drive programs and innovation across the entire portfolio of buildings.
Our smart building strategy and approach enabled Vicinity Centres to realise their technology vision in an innovative, agile, and effective way.
The Client
One of Australia’s leading retail property groups with $24 billion in retail assets under management across 63 shopping centres, making it the second largest listed manager of Australian retail property. The Group has a Direct Portfolio and manages 31 assets on behalf of Strategic Partners, 28 of which are co-owned by the Group.

Challenges
Following the merger of two of Australia’s most established names in the business; Federation Centres and Novion Property Group (2015), the merger expanded the number of building systems and vendor technologies which made compliance reporting (NGERS, NABERS, ESG) problematic and time consuming across the portfolio.
The large mix of different technologies and vendor solutions presented the following challenges:
- Inordinate 3rd party costs from vendors, consultants and solutions providers who charged to provide access to the client’s own information.
- Additional time spent making requests to external parties or between departments to gather sustainability and energy data to produce reports
- Without real-time energy data, the client had limited capability to take advantage of advanced energy optimisation opportunities such as demand response or peak demand management.
Digital Engineering
We were engaged to provide a digital engineering solution that automated the collection, consolidation and processing of operational and environmental building data that involved these steps:
- Determining the strategic vision – understanding the business case, identifying key criteria for success, defining a performance culture for the key users, research and planning.
- Defining user stories – ensuring that project outputs and outcomes aligned with user needs and were meaningful, effective and measurable.
- Defining accurate project pricing, timings, and project management milestones
- Providing quality assurance – conducting systems testing and risk management to ensure as-built digital architecture is delivered as specified.
- Designing dashboard reporting for business intelligence – a range of reports designed to convey key metrics, performance indicators, on-the-fly calculations and burn-down charts for the key user stories developed.
The solution eliminated unnecessary vendor solutions, reduced data duplication and waste, optimised team resources and unlocked advanced capabilities and innovation programs across the entire portfolio of buildings.
IoT Energy Data Platform Benefits
Direct Cost Savings
- Eliminated $400k per-annum in redundant vendor-based products and services.
- Freed up 12-14 full-time equivalent personnel for reallocation.
Indirect Cost Savings
- Positioned the in-house dev team to automate error tracking and detection of machinery faults to avoid unplanned down-time and reduce equipment lifecycle costs.
- Reduced reliance on external vendors by bringing reporting and new development capability in-house and taking control of building data.
- Automated the ingestion and normalisation of 20+ cross departmental data sets to provide high quality, structured data for reporting.
- Automated 40+ reports through customised dashboards developed in Tableau® that reduced manual information gathering, improved time to report and decision making.
Greater Visibility
- Enabled feedback and compliance monitoring allowing management to gauge ROI effectiveness, manage reporting risks and further develop and manage business intelligence (BI) systems.
- Created a consolidated asset register and related metadata which improved the ‘build to sell’ or ‘build to manage’ value of building stock to stakeholders, prospective investors, and buyers.

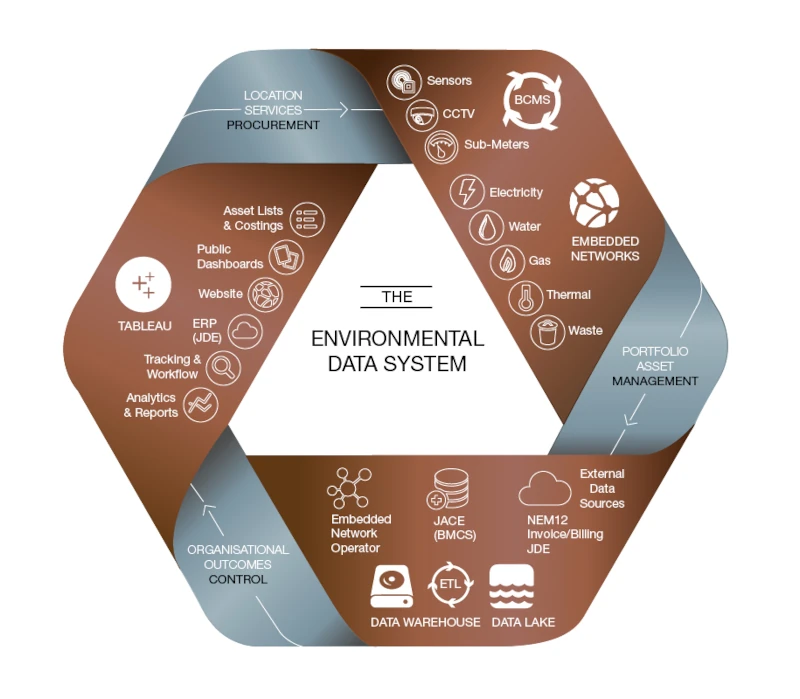
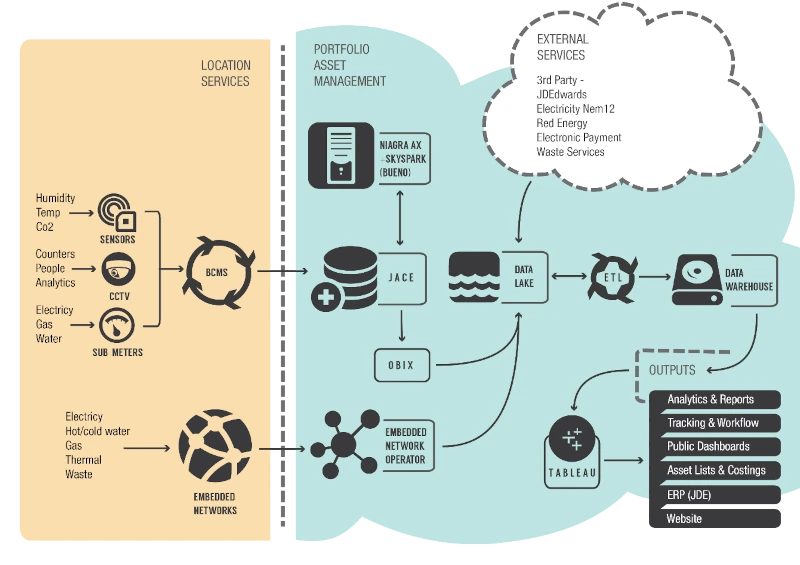
Technical Overview
Digital Integration of Infrastructure
- Utility NEM12 and smart metering
- Data importing functions (FTP/email) for location and external services
- BMS data resolution
- Provisioning of embedded network operators
- SQL data-lake and database provisioning
- Tableau - user interface integration
Digital Data Integration
- 15-30-minute interval data or smart metering device data
- Data input - normalise and lay down data through ETL and APIs into storage
- Range of file formats, from CSV to XML to Excel
- Automated data capture requiring no human intervention
- Record external services data, tariffs, emissions, calculations, and benchmarks for output
Digital Data validation
- Ensure the ETL program stores data quality information in the database such as number of readings, expected readings and missing data reports
- Provide an exception report of missing data sets, or data quality issues
- Provide a visualisation of data availability and completeness
Secure Systems
- Hosted on VPS with high availability for storage
- Encompass onsite and offsite backup files and procedures
- Security Operations (SecOps) handling for websites and connections
Data Types
Finance, BMS/PWMS, Electricity, Solar Generation (gross), Natural Gas, LPG – Stationary, Water, Air Travel, Diesel – Stationary, Waste, Refrigerant, Weather
Lasting Outcomes
Vicinity’s IoT energy data platform solution exceeded mandatory and voluntary reporting requirements and over successive years post go live. This has provided additional value across the portfolio such as:
- Enabling innovation by providing strategic, sustainability and regional operations with the capability to explore data without constructing complex, time-consuming, and rigid models in typical reporting tools.
- Allowing any user to gain insights from building data regardless of skill level, as per user need with a class-leading single-source-of-truth.
- Empowered users with quality data that could be relied upon.
- Centre operations could see operations in real time with simple yet powerful performance metrics to drive new efficiency programs or adapt existing ones.
- Financial teams could run reconciliation tasks with confidence and provide meaningful projections, forecasts and dynamic models.
- The single-source-of-truth data model enabled users to slice-and-dice data sets that were formerly disparate and incompatible. For example, operations could explore the concept of energy intensity by analysing real-time consumption and costs against occupancy rates, operating hours, and weather conditions.
Conclusion
The IoT energy data platform we developed for Vicinity Centres allowed the company to rationalise its key data systems, supporting IT infrastructure; databases and servers, cut operating costs by automating manual data collection, entry and consolidation tasks, and enabled advanced analytic programs and applications to be run across the organisation’s extensive energy and environmental datasets. As more data sources were connected, the reporting and analytics capabilities expanded markedly to provide a comprehensive set of energy performance indicators for smart control and advanced analysis of operational technology.
Imagine if there were no barriers to analysis and reporting within your organisation?
Contact Buildings Evolved to realise your digital engineering vision, turn change into opportunity by capitalising on building, grid and energy market intelligence.