

By making smart building data more accessible, the DCH will drive innovation amongst a broad ecosystem of participating service providers, leading to better products, increased competition, lower prices, and an increased value proposition for participants.

Location: Australia
Industry: Education
Project Funding: $30m
Project Website: http://ihub.org.au
Project Funder: This project was funded by the Australian Renewable Energy Association (ARENA), a federal government agency.
Scope
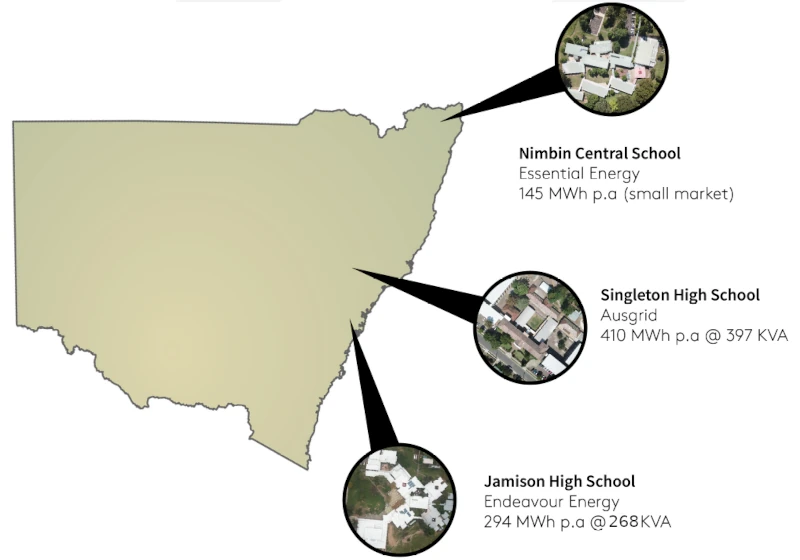
As a part of i-Hub Data Clearing House (DCH) initiative, CSIRO is working with NSW Department of Education, and Buildings Evolved on a project involving the installation of battery storage and HVAC control equipment in three schools:
- Jamison High School (Penrith, Greater Sydney);
- Singleton High School (Singleton, Hunter Valley); and
- Nimbin Central School (near Lismore, Northern Rivers).
The project provides proof-of-concept testing to onboard 3-trial sites from SINSW’s building portfolio and demonstrates DCH’s operational effectiveness. Namely, the demonstration of demand flexibility of building assets to support the energy network by ‘tuning’ of building optimisation strategies using various technology mixes achieved to favour occupant comfort over financial benefit or vice-versa depending on the requirements of the client. In this case, the NSW Department of Education has the objective of providing improved learning environments to deliver better educational outcomes while driving stronger economic outcomes for the state.
Source: https://github.com/intelligent-environments-lab/CityLearn
Modelling Outcomes
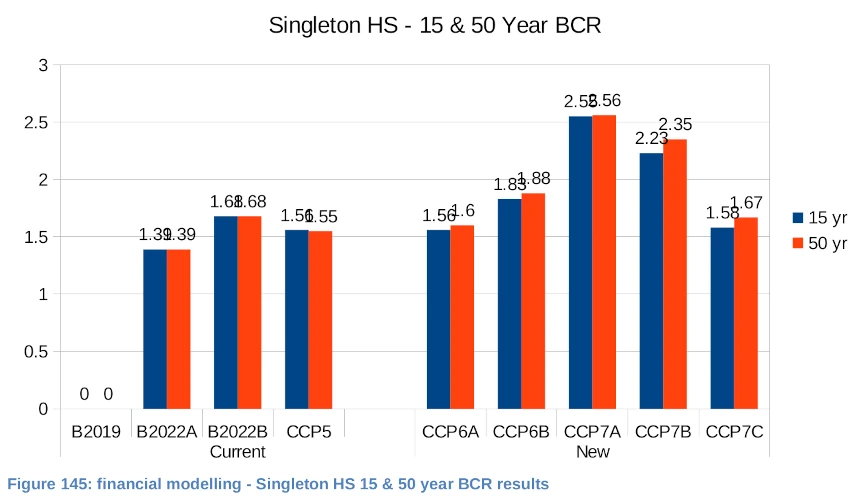
The modelling demonstrated HVAC controls without battery consistently return the best benefit-cost ratio (BCR) for all three sites in DCH 6.1, of above 2x BCR. These results mirror the preliminary modelling work, undertaken prior to procurement of the batteries and additional solar PV on the three school sites covered in this report. By comparison, the modelled business case for battery storage systems for the purpose of energy arbitrage shows a lower financial return, although this is improved by utilising batteries within the FCAS market (and wholesale spot pricing). The scenario with larger solar PV, without batteries or controls and using retail energy accounts, was also notable, showing an impressive BCR in its own right for two of the sites.
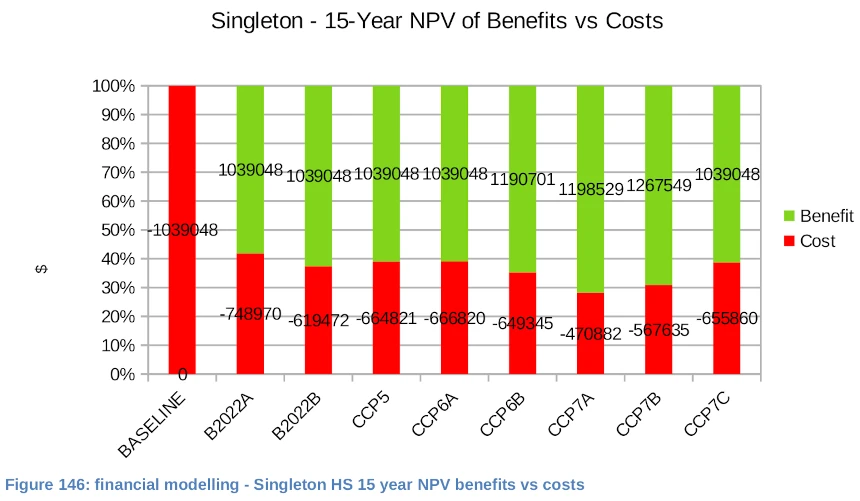
The results indicate that where batteries are introduced into the mix of technologies, the BCR and NPV are often reduced. Singleton HS, the largest energy consumer, produced the best financial returns of the three schools studied, and the best BCR – when using the CCP7A scenario (solar PV + HVAC controls). Over 15 years, the modelling indicates a saving of $1.19m can be made with a spend of $0.47m at this one school location.
Additionally, HVAC controls have the ability to improve financial returns while simultaneously improving occupant comfort and thus educational outcomes.
Works Completed
| System | Singleton HS | Jamison HS | Nimbin CS |
|---|---|---|---|
| Existing PV | 25KW | 35KW | ✘² |
| Added PV | +35KW | +25KW | +60KW |
| Total PV | 60KW | 60KW | 60KW |
| Added Battery (KWh/KW) | +60/30 | +60/30 | +60/30 |
| HVAC Controls | ✘¹ | ✔ | ✔ |
| Brick Modelling | ✔ | ✔ | ✔ |
| PV Control | ✔ | ✔ | ✔ |
| Monitor Battery | ✔ | ✔ | ✔ |
| Flow programming | ✔ | ✔ | ✔ |
| Data to CSIRO DCH | ✔ | ✔ | ✔ |
| Optimisation stage 1 | □ | □ | □ |
| Optimisation stage 2 | □ | □ | □ |
¹ Scope removed due to pandemic related cost increases
² Nimbin CS had an end-of-life 2KW system, producing <1KW, deemed to be non-material
The Challenge: How did we assess system sizing and the best options to proceed with?
Project Phases
The original intent of the project was to implement the infrastructure required to produce real-world data from which to draw conclusions regarding the viability of the various technologies and configurations. Given the delays in installing this infrastructure, due to a number of complications including the onset of the Covid-19 pandemic, the course of this project had veered to rely on a modelled/simulated output.
Modelling the “What-If”
Establish a Ground Truth & Validate
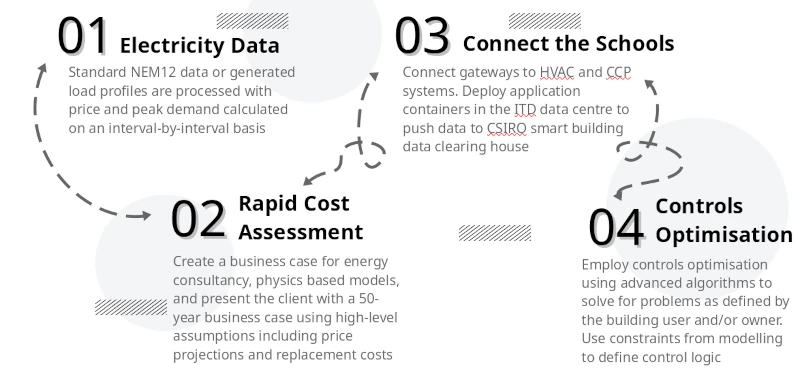
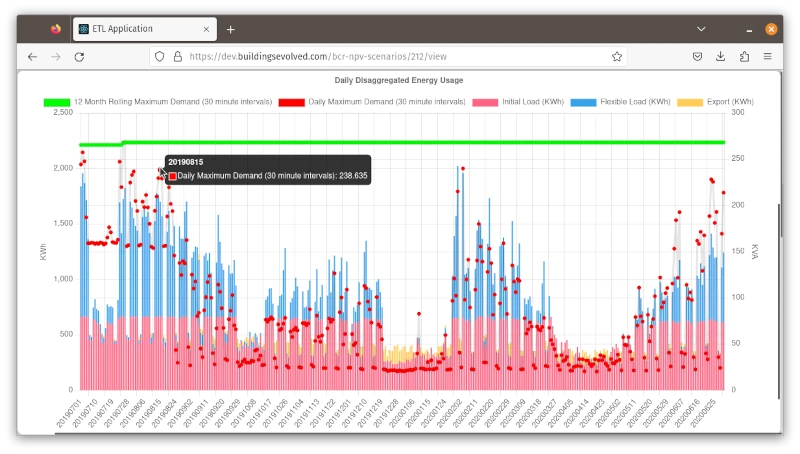
We gathered NEM12 electricity utility data for multiple years. We developed software to use machine learning for behavioural analysis to determine load variability and through that, flexibility. Loading the data into a chart reveals the following information, noting the rolling maximum demand calculations using prior 12 months of data to calculate the first day accurately. Invoice generation is used to complete further validation of the ground-truth.
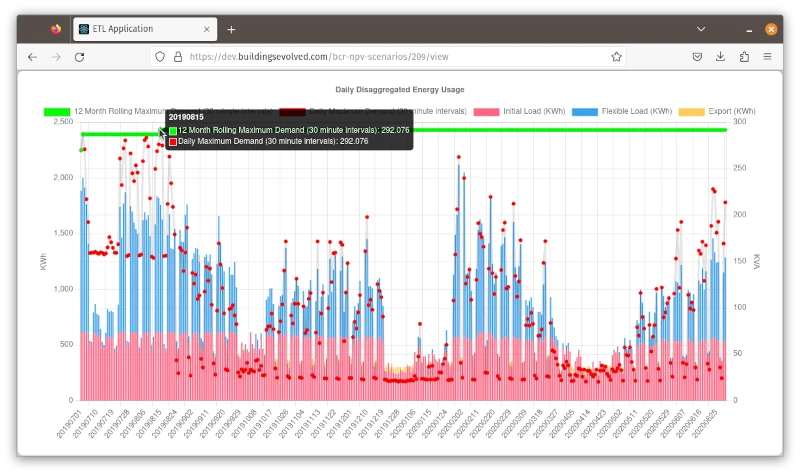
Note also that this chart is from the metering data only - no sub-meters or other data sources were used to create this analysis.
It becomes extremely easy to see where the maximum demand events are occurring: late July and early August. Summer doesn’t get close to winter in terms of the impact of a maximum demand event. We can ascribe this phenomenon to the efficiency of HVAC compressors - the COP drops precipitously at low temperatures, rendering the HVAC no better than a resistive bar heater in terms of efficiency.
Finding a Maximum Demand Event
So. Let’s drill in to the peak demand event day on 15th August 2019 and look at raw data. Keeping in mind that we have raw 15 minute interval data here, so this will roughly double to get the 30 minute demand window.
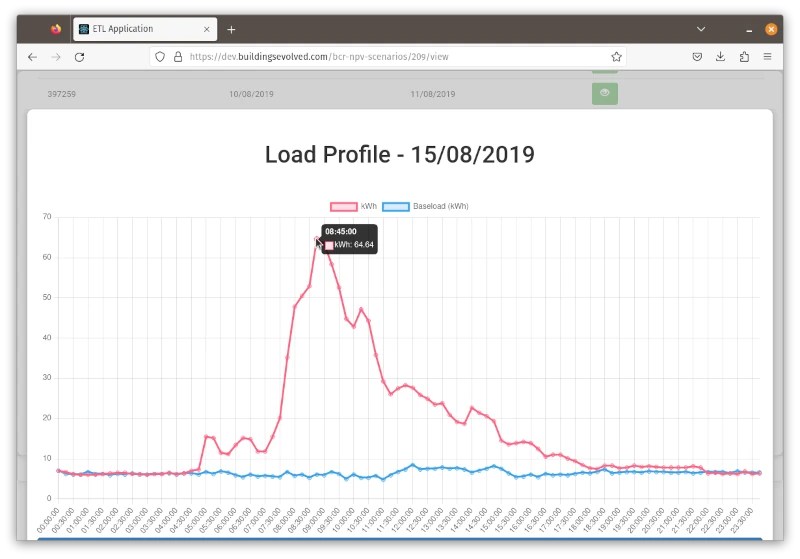
OK, so we have identified two things: the classrooms are likely extremely cold in the mornings, and in response the staff and students turn on the HVAC roughly at the same time between 08:30 and 09:00 causing a huge spike in maximum demand. So we have uncomfortable classrooms AND a poor energy outcome.
The obvious question: What can we do about this?
What-If We Add More Solar?
Let’s add 25KW to the existing 35KW of Solar PV and make a 60KW system. What does that do to our ground-truth? The overall site demand is 292KVA, so the solar PV at maximum output constitutes less than 1/5 the total maximum demand. Applying some maths, we can modify the ground-truth consumption to render this chart:
 Model: Add 30KW of solar PV to existing 30KW system.
Hm. Seems that Solar PV has some impact upon consumption figures. But in this circumstance, it has helped to mitigate a maximum demand event, to which we can attribute a sunny morning in mid-August, being 6 weeks after winter solstice. By 54KVA. Checking this against BOM data, there indeed was no cloud cover on this day.
We can conclude that the impact from solar system increase is good, but not a panacea for all ills.
What-If we Introduce Demand Management?
Next. What if we control the HVAC systems? We could turn them on early, allowing pre heating or cooling of the classroom. This would make the classroom more comfortable, and also eliminate the maximum demand issues. So, what happens if we aggressively load-shift while simultaneously improve efficiency by 30% (not an unreasonable number)?
This.
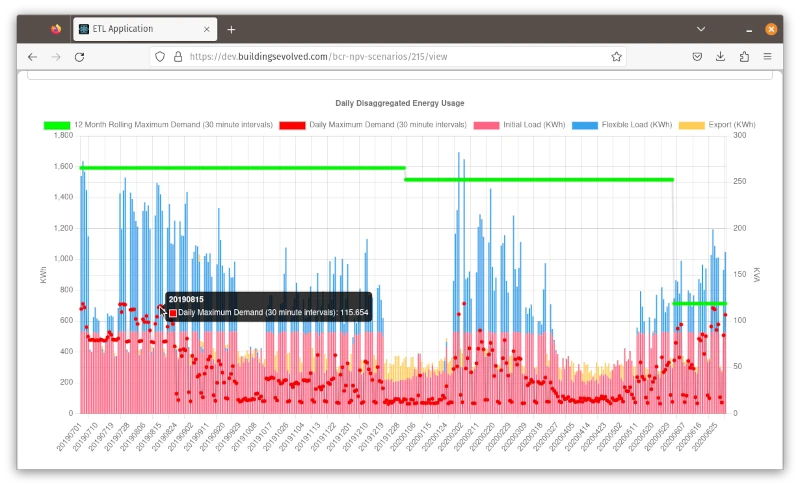 Model: Add 30KW of solar PV and use load-shifting to reduce max demand
Now we’re talking. All those maximum demand events in July and August are gone. Overall energy consumption has reduced per the assumption that HVAC controls will improve consumption and reduce demand - backed by many an academic article, study or pilot. We can see the KVA stepping down during the year as the maximum demand rolling window runs through the 12 month cycle.
It ends up at 115KVA. Down from 292KVA. Impressive.
Load Shifting
If we drill into the 15th August 2019 again, we can see what is happening to achieve this outcome. The yellow ‘parent’ is the ground-truth data - representing the ‘before’. The red line represents the ‘after’ while the blue line identifies non-variable load. The slight dip during the day is the impact of PV + HVAC controls.
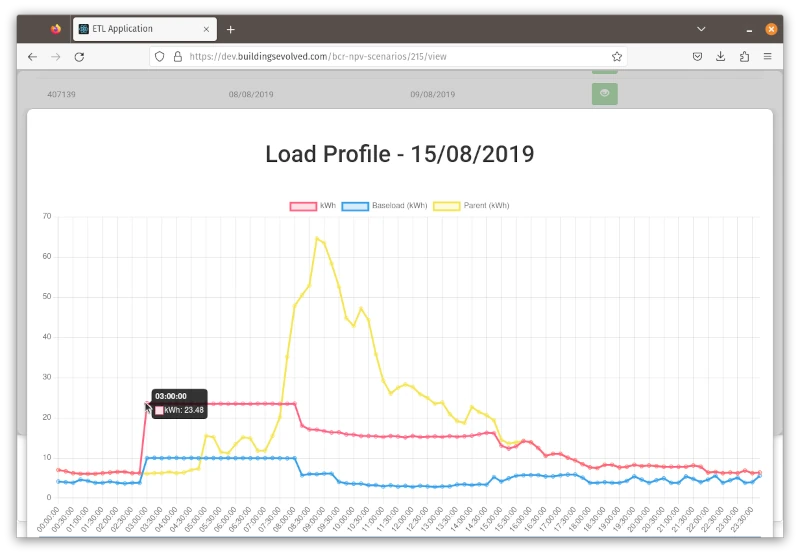
Analysing the chart, the impact of the load-shift is apparent. The area of the chart between the red and yellow line during the middle of the day is being shifted to 3am - 8am.
Financial Output
From here, the software is built to load network and retail tariffs, wholesale spot price of electricity and other financial and engineering assumptions (capex, opex, replacement costs etc) to be able to produce 50-year discount cash flows, as well as 15 and 50 year BCR and NPV
Key outcomes
- Modelling demonstrated above 2x 15-50 year BCR
- Defined the optimal technology mix to achieve goals
- Demonstrated optimal thermal comfort model
- Quantified the benefit of demand flexibility and DER
- No on-site equipment, utilise IT Network & data centres
- Open source software
- Light-weight modelling requirements
- Engineered to avoid vendor lock-in
iHub DCH 6
Project Partners & Participants
| Organisation | Role |
|---|---|
| NSW Department of Education | Project partner, beneficiary |
| CSIRO Energy | Project partner |
| Buildings Evolved | Project partner |
| Australian Institute of Refrigeration Air Conditioning and Heating | Project governance |
| Australian Renewable Energy Association (ARENA) | Project funding |
Video shows the CSIRO predictive battery control algorithm in action, as used in this project and featured in the above battery peak-lopping and arbitrage output.